Plymouth Sound and the Tamar
What's really in the water
Rain falls, the sewers fill, the overflows open. A few hours later that water is at the beach. We model where it goes, say how sure we are, and publish it. Whether you get in is yours to decide.
Where we actually are
There is nothing in the water yet
Worth saying plainly, because most of this kind of site implies otherwise. We have no buoys deployed and no buoyage in the Sound. Nothing here is a live reading off our own sensor, and where a number comes from somebody else's feed we say so.
What we have is the water itself, which is the part most people skip. We know the shape of this estuary, the depth of its bed, what the tide does to it hour by hour and what the rivers push through it. That is enough to work out where a spill goes, and it is the thing you cannot get from a sensor on a post.
How this gets better
The model aims the sampling, the sampling sharpens the model
Sampling water is expensive and slow, so the question is never "test more", it is "test where". Run the hydrodynamics on a real spill and you get a prediction with an extent: this reach, these hours, roughly this strength. That is a testable claim, and it tells you exactly where a bottle is worth taking and when.
So the sequence is model first, then a targeted campaign aimed by it, then those results back into the model. Each round narrows the parts we are guessing at. The biggest of those is what actually leaves the pipe, which nobody measures, and which a handful of well-placed samples during a real discharge would pin down better than a year of routine monitoring somewhere convenient.
Buoys come at the end of that, not the start. A permanent sensor is worth deploying once you know which few hundred metres of water it should be sitting in, and the model is how you find out.
What a buoy would read
Seven things, once there is something in the water
This is what we intend to measure, not what we are measuring. The first two are the ones that move fastest after a spill, and the last is the pair the Environment Agency actually grades beaches on.
pH
How acid or alkaline the water is. A sudden swing means something has entered it.
Turbidity
How cloudy it is. Storm runoff and sewage push this up within hours.
Chlorophyll-a
How much algae is in the water. Above about 15 micrograms a litre you may be looking at a bloom.
Dissolved oxygen
What is left for everything living in it. Organic pollution pulls it down.
Salinity
A sharp drop means fresh water is pouring in, which usually means runoff or an overflow.
Temperature
Warm water grows bacteria faster, and flags a warm plume coming out of a pipe.
E. coli and enterococci
The two indicator bacteria. Lab work rather than a sensor, and the pair the Environment Agency grades beaches on.
Where it goes
A spill does not spread in a circle
It follows the water. So we take the Ordnance Survey tidal and surface-water shapes for the whole South West, lay a 25 metre grid over them, and trace each live discharge outward through water only. It cannot cross land. Narrow channels concentrate it, the way they do in reality. Strength falls off with the distance the water travels, not the distance a gull would fly.
Rivers carry it too. Contamination runs down the river network from inland outfalls, and where a dirty river meets the sea we hand it to the coastal model, so a spill miles upstream can still reach the beach at the mouth. How heavily a site counts is set by its own six years of spill history, not just what it did today.
This runs everywhere, on every spill, in seconds. It is a good deal better than a circle on a map. It is still an estimate, so we draw it as a fading wash rather than a hard edge, because a hard edge would claim more than we know.
One real spill
The tide decides which beach
For the Tamar we built something heavier. It is a hydrodynamic model of Plymouth Sound, the Hamoaze and the tidal river: about 49,000 cells carrying the real depth of the bed, driven by the measured tide at Devonport and the gauged flows of the Tamar, Tavy, Lynher and Plym. Then we put a real spill through it.
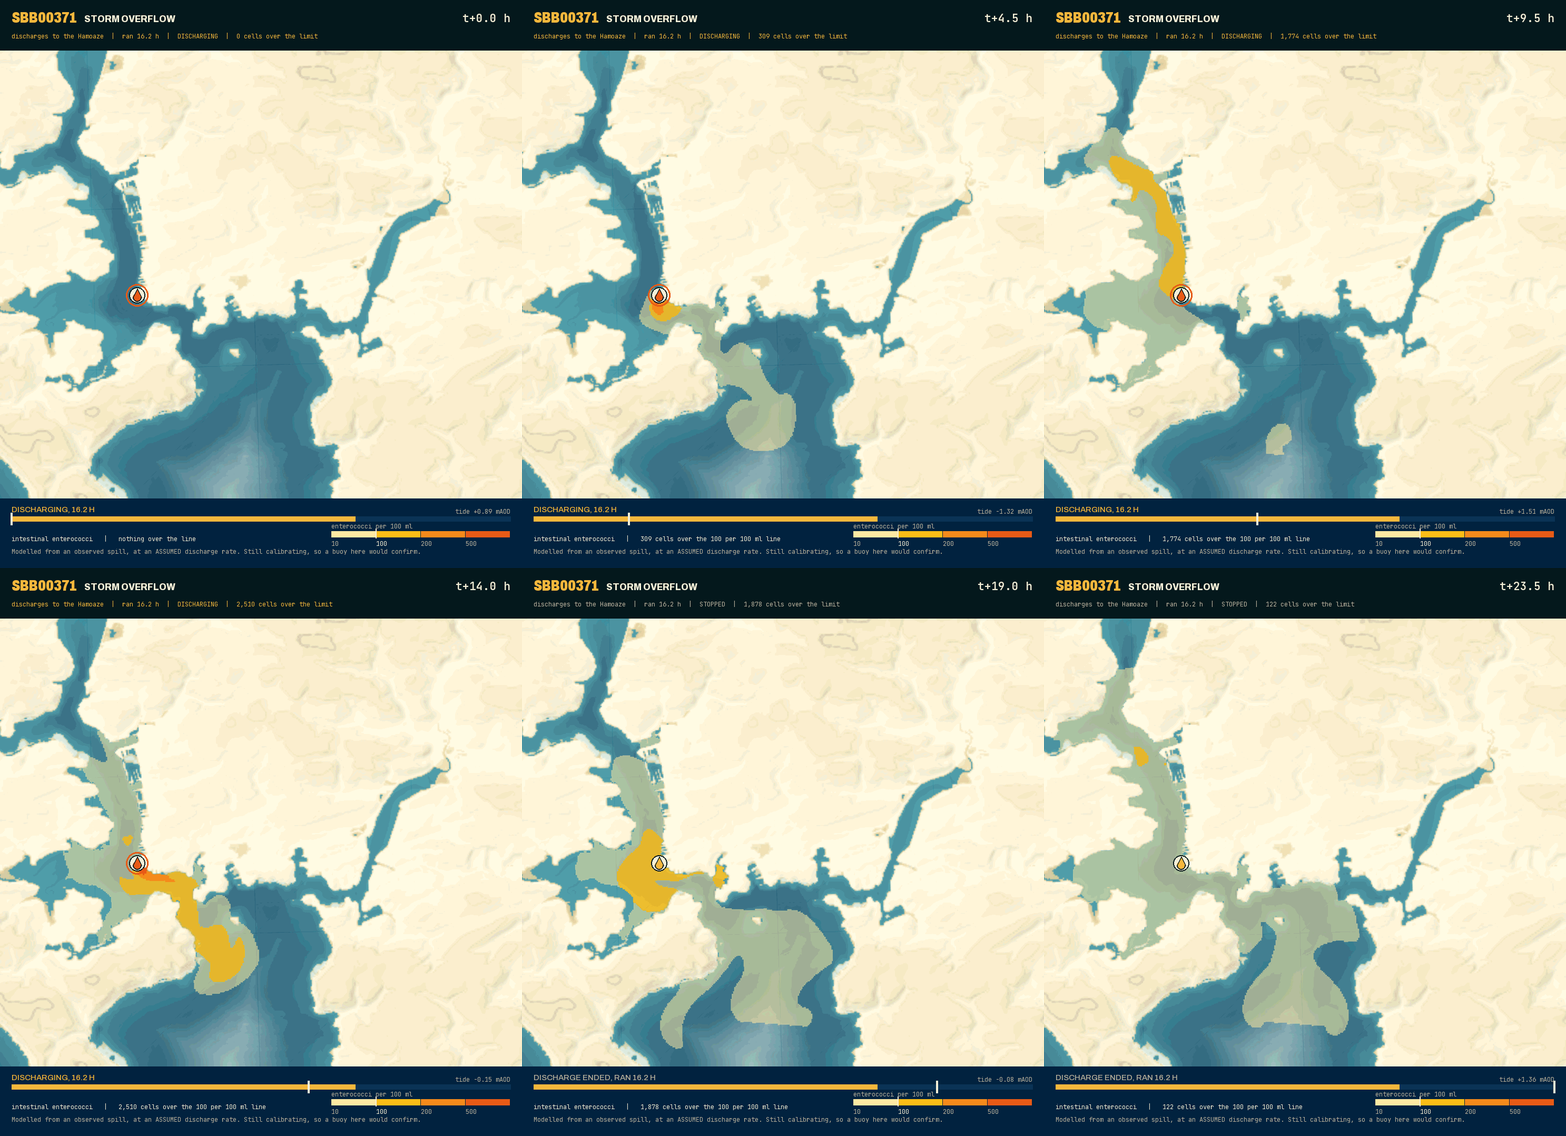
Watch the tide work. The plume runs down the deep channel on the ebb and comes back on the flood. At the shore by Devil's Point it was detectable two hours after the overflow opened, crossed the enterococci line twelve hours after that, and was back under it inside a day.
Run the same spill on a spring tide and it goes somewhere else entirely. One beach gets three times better, another gets twenty-six times worse. That is why a fixed list of at-risk spots is wrong for half of every month, and it is the argument for forecasting this rather than surveying it.
Two things we do that are easy to skip. We carry both indicator bacteria and report the stricter one, because enterococci dies off more slowly than E. coli and its share of the plume grows the further it travels, so leading with E. coli would understate how close the water sits to the line at the range people actually swim. And we read the answer at the shore, in shallow water, not out in the channel where the plume runs several times stronger.
The honest bit
What we cannot tell you
- Nobody measures what leaves the pipe. The public record says an overflow ran, and for how long. Never how much, never how strong. So we model the journey carefully and the source approximately, and we say which is which.
- One modelled spill is not a classification. Bathing water status is a statistic built from years of lab samples. We do not replace it, and a model cannot regrade a beach.
- The model is unvalidated at the shore. The tide it runs on is checked against the measured record at Devonport. The bacteria it carries are not yet checked against anything we sampled ourselves. That is the gap the campaigns close, and until they do, treat the extent as a good estimate rather than a measurement.
- When we cannot see, we say so. A feed that stops reporting is marked unknown, not clear. We never fill a gap with a guess, and nothing missing is ever dressed up as good news.
Where it comes from
Sources
- Environment Agency bathing water API
- National Storm Overflow Hub
- South West Water, Southern Water and Northumbrian Water event duration monitoring
- Open-Meteo rainfall and wind
- UKHO tidal predictions
- Ordnance Survey and OpenStreetMap water shapes
- Our own buoys